
Not always. On September 24, 2026, the AMORPH founding team read the same paper as a PDF and as journal XML (JATS). In the PDF, one table row became a single line of text with nothing but numbers, while in the XML all 11 tables were read with their rows and columns intact.
XML is a file format that marks the structure of a text with labels called tags, and journal XML (JATS) is an XML format that holds a paper's title, sections, paragraphs and tables along with their structure, defined as the US standard ANSI/NISO Z39.96 (NISO). This comparison comes from the AMORPH founding team reading one paper as a PDF and as journal XML and testing one PDF table-finding tool, so it does not apply as is to every PDF or every AI that analyzes papers.
Why do tables in PDF papers lose their structure?
Because PDF is a format that records where on each page to draw characters and lines. In a PDF that does not mark rows and columns as structural information, the reading tool has to guess the rows and columns from the positions of characters or from lines.
The PDF standard represents page content as a sequence of instructions describing the graphical elements to draw on the page, and separately defines how to mark tables with structure elements such as Table, TR (row), TH (header cell) and TD (data cell). Whether to include this structural information, however, is up to the program that creates the PDF, and the standard itself notes that the relationships between headers, rows and columns are usually left for the reading program to infer (ISO 32000-1, 2008).
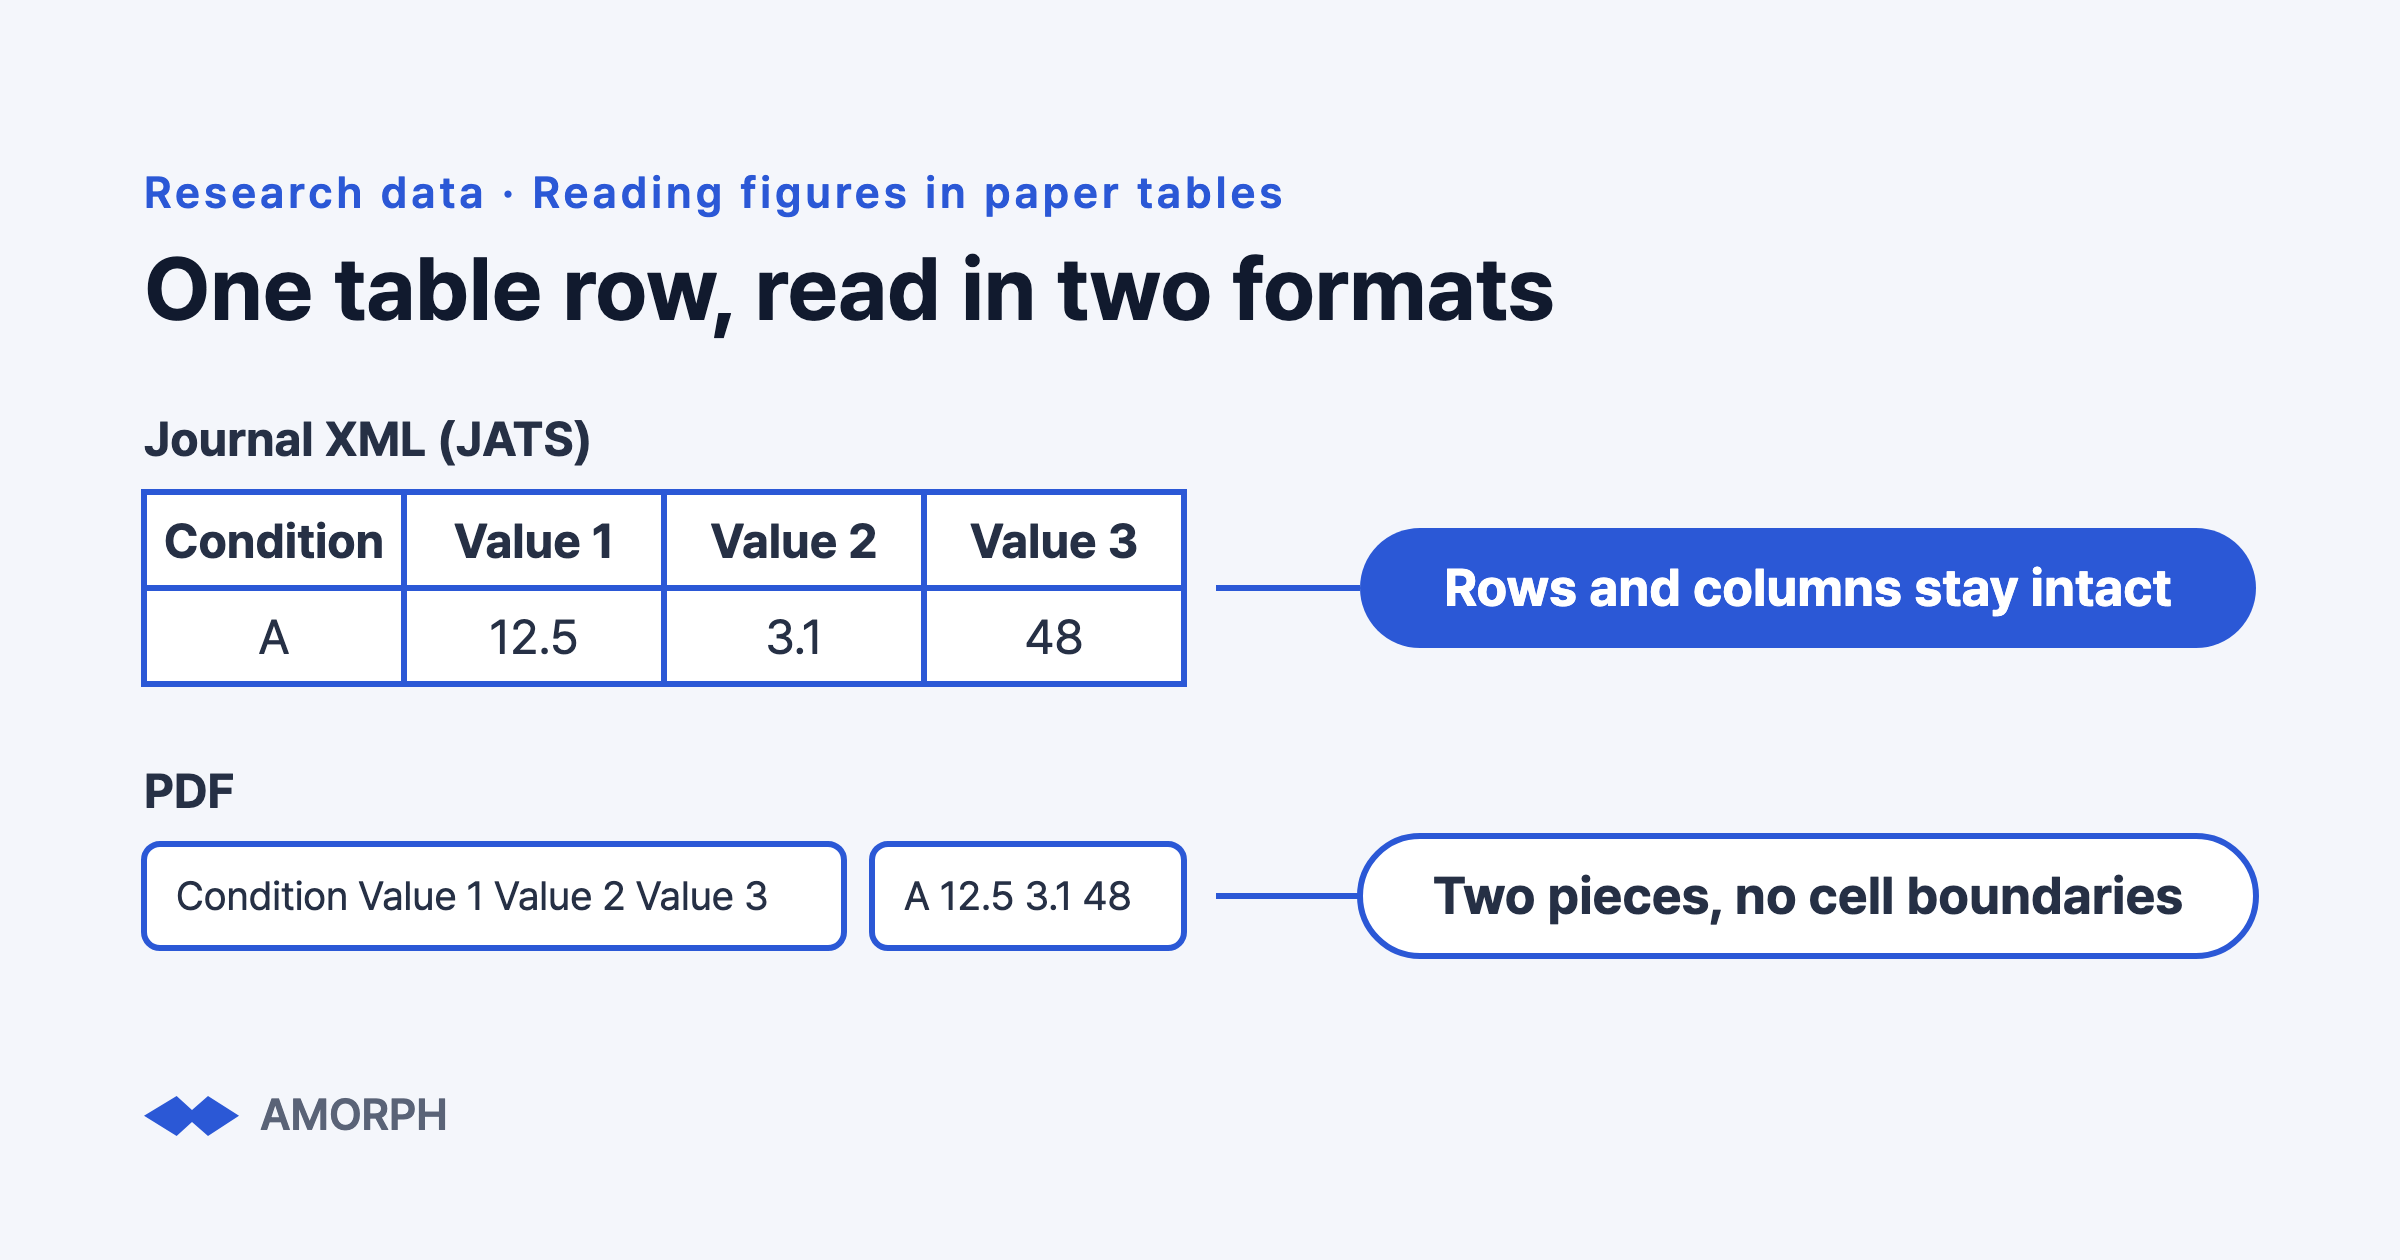
On September 24, 2026, the AMORPH founding team read that paper's PDF page by page with pypdf, a public Python library anyone can download and use, and split the text into lines. The whole PDF came apart into 1,195 text pieces. A Python library is a bundle of code that programs written in the Python programming language can use. A text piece is one unit of the text extracted from the PDF; in this comparison, each line of the text extracted from each page counted as one piece. A table row became a single text piece with nothing but numbers, and the column headers ended up in a different text piece.
The same day, the team ran the table-finding feature of PyMuPDF 1.27.2, another public Python library for handling PDFs, with its default settings. It found no tables at all. After switching to the setting that infers rows and columns from character positions, it treated the entire body text as one table. The default setting of this feature finds cell boundaries from the lines and shapes drawn on the page, while the other setting creates virtual row and column boundaries from character positions (Artifex's PyMuPDF documentation). Even with the same tool, this task, commonly called "PDF table extraction", gave results this different depending on the setting.
Take the example in the figure above. A table with the header "Condition | Value 1 | Value 2 | Value 3" and the row "A | 12.5 | 3.1 | 48" keeps its rows and columns in journal XML. In the PDF, the header becomes one text piece, "Condition Value 1 Value 2 Value 3", and the row becomes another, "A 12.5 3.1 48", split into two pieces with no cell boundaries. The number of words in the header does not match the number of values either, so the text alone cannot tell you for certain which column 12.5 belongs to.
What changes when you read journal XML (JATS)?
Journal XML holds a table's rows, columns, title and footnotes as structure, so when we read the same paper as journal XML, all 11 tables were read as rows and columns.
The JATS table element bundles a table's rows, columns, title and footnotes together, and the row element holds all the header and data cells in a row (US National Library of Medicine, JATS 1.4 Tag Library). On September 24, 2026, the AMORPH founding team confirmed that all 11 tables in that paper's journal XML were read as rows and columns. Even so, three things need separate handling when reading journal XML.
- When some cells are merged, the number of cells differs from row to row, so you must first decide how to expand merged cells.
- Footnote markers after a value easily get mixed up with the digits of the value. For example, if 12.5 is followed by footnote marker 2, simply joining the characters gives 12.52.
- Table titles, header rows and footnotes also state units and conditions, so read them separately from the body rows and keep their locations.
Reading the same paper in two formats, the tables survived only as line-by-line text in the PDF, while in journal XML all 11 tables kept their rows and columns (AMORPH founding team, September 24, 2026).
| Item | Journal XML (JATS) | |
|---|---|---|
| Reading method | Text extracted page by page with pypdf | JATS table elements read as rows and columns |
| Split into | 1,195 text pieces (lines on each page) | Sections, paragraphs and table rows |
| One table row | One text piece of numbers only | One row divided into cells |
| Column headers | In a different text piece from the values | Kept as the name of each column |
| Table structure | Remains only as line-by-line text | All 11 tables keep their rows and columns |
| Table-finding tool | 0 tables with PyMuPDF 1.27.2 default settings | Not used (the structure is already there) |
Where can you get journal XML?
If the paper is an open access paper in the life sciences or medicine, meaning anyone can read it for free, first check whether its journal XML is available from the paper repository PubMed Central (PMC). PMC offers the full text of papers licensed for reuse as downloadable XML in the NISO JATS format (NCBI PMC). For papers in other fields, check whether the publisher's website also offers an XML file for download.
PMC is a free repository of the full text of journal papers in the life sciences and medicine, run by the National Library of Medicine under the US National Institutes of Health (NCBI PMC). Even so, not every paper in PMC can be reused, and the terms of use differ from paper to paper, so check the license stated on the paper first (NCBI PMC).
CC BY 4.0 is a license that lets you copy, distribute and adapt material, including for commercial purposes, as long as you credit the source, link to the license and indicate any changes (Creative Commons). The paper the AMORPH founding team used for the comparison was also published under this license.
How do you check that the figures AI read are correct?
You need to check again that the figure the AI proposes actually sits in the same row and the same column of the table it cites, and that the unit and experimental conditions match. Comparing the quote with the source character by character is not enough, because quoting one table row also puts the values of every other column in that row inside the quote.
- Check that the quoted row is a body row of the table rather than the header row, and that the header of the column holding the value matches the measurement to be recorded.
- Read a value written like "<10" as an upper limit, not a single point value.
- Check whether the unit is in the table title or the column header, and whether the experimental condition that row refers to is the same as the experiment to be recorded.
- Values in a column that the paper's footnote says were obtained by subtracting other values are calculated values, not measurements.
What about papers without XML?
For papers without XML, AMORPH recommends that a person look directly at the table in the PDF and verify the figures before recording them. As shown above, PDFs easily lose table structure, and table-finding tools, depending on the setting, either found no tables at all or read the whole body text as one table.
If data files such as Excel or CSV were published with the paper, it is safer to check the figures in those files, where the table structure survives. Figures in body sentences are often more ambiguous than those in tables. When a sentence has several numbers in the same unit, or a number comes with a word like "about" or "more than" that signals an approximation or a one-sided range, it is hard to tell from the text alone which value refers to what, so it is safer for a person to check it in the table.
What should you watch out for in research data received as Excel files?
Formula cells may be saved without calculated results, so check formula cells separately before reading values.
In September 2026, when the AMORPH founding team read the Excel workbook of one public research dataset, all 2,375 formula cells had been saved without calculated results. A dataset is the material collected in a study, bundled into files, and a workbook is a single Excel file containing multiple sheets. Had we read only the stored values, these cells would all have come up blank.
When you run into such cells, decide before reading the values whether to recalculate the formulas or keep the formula text itself as evidence. This result comes from one dataset and does not mean that most research Excel files are like this.
So where should you start?
First, sort the papers you have into those with journal XML available and those with only a PDF, and add a separate step where a person verifies the table figures in PDF-only papers. To build up a lab's papers and experiment records along with their evidence, see R&D AX.
Method and limitations
- The paper used for the comparison is one open access paper published under CC BY 4.0.
- PDF text was extracted with pypdf, and PDF table finding was tested with PyMuPDF 1.27.2 using its default setting and its character-position setting.
- The results of having actual external AI models read the same paper differed from run to run.
- Results may differ with other tools or settings, or with PDFs from other publishers.